3.1 Rules and dashboards
Task 3.1.1: Provided dashboards
OpenShift provides a set of default dashboards for cluster adminstrators and OpenShift users.
- Cluster dashboards
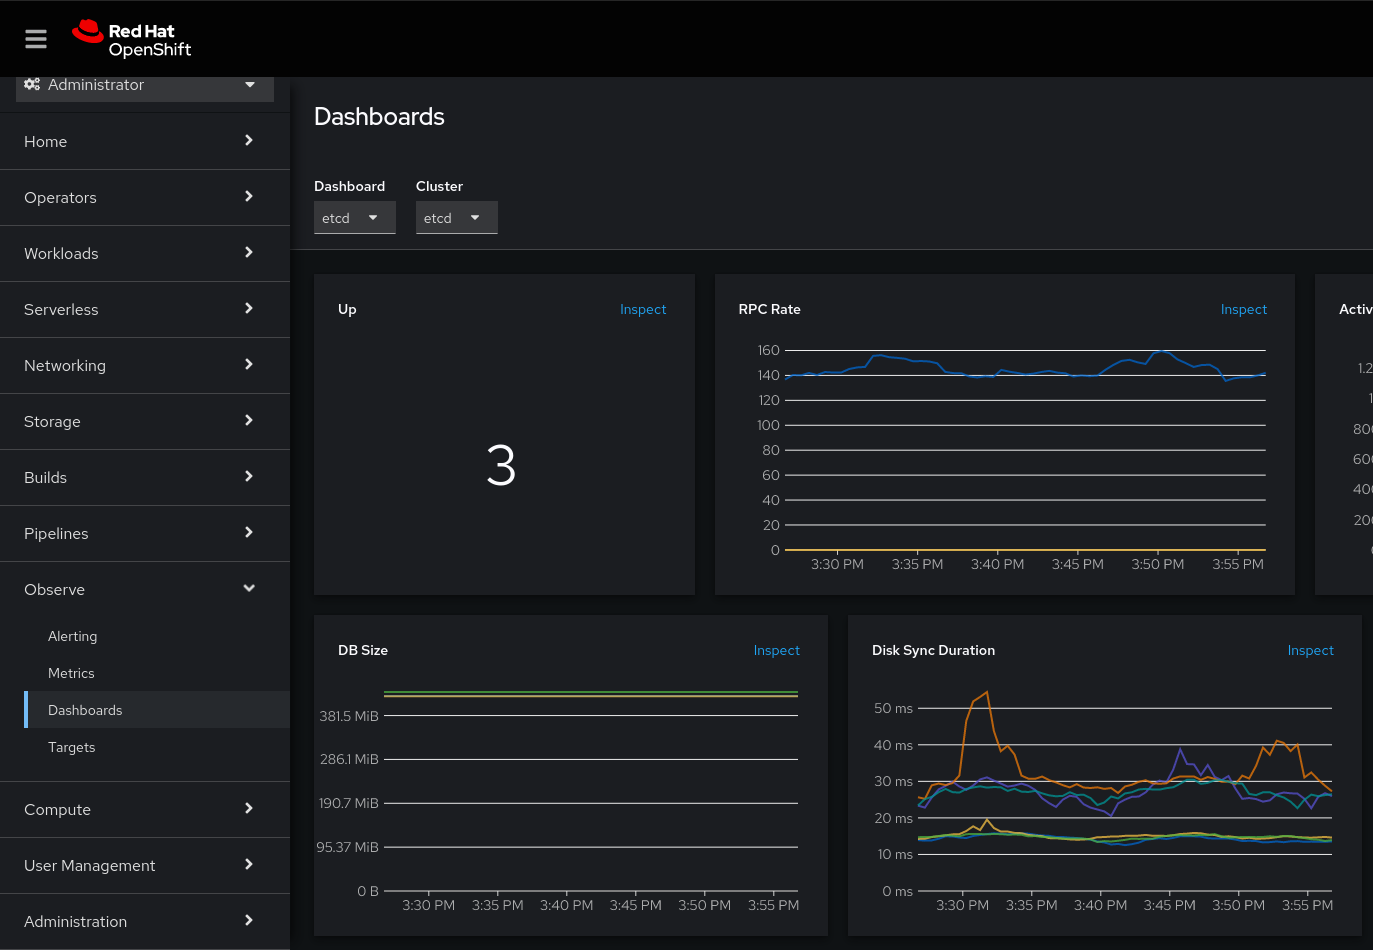
To get a sense of where these dashboards can be found, let’s take a look at the performance of the etcd cluster.
Navigate to Observe -> Dashboards on the web console and select etcd in the dashboard drop-down list.
- User dashboards
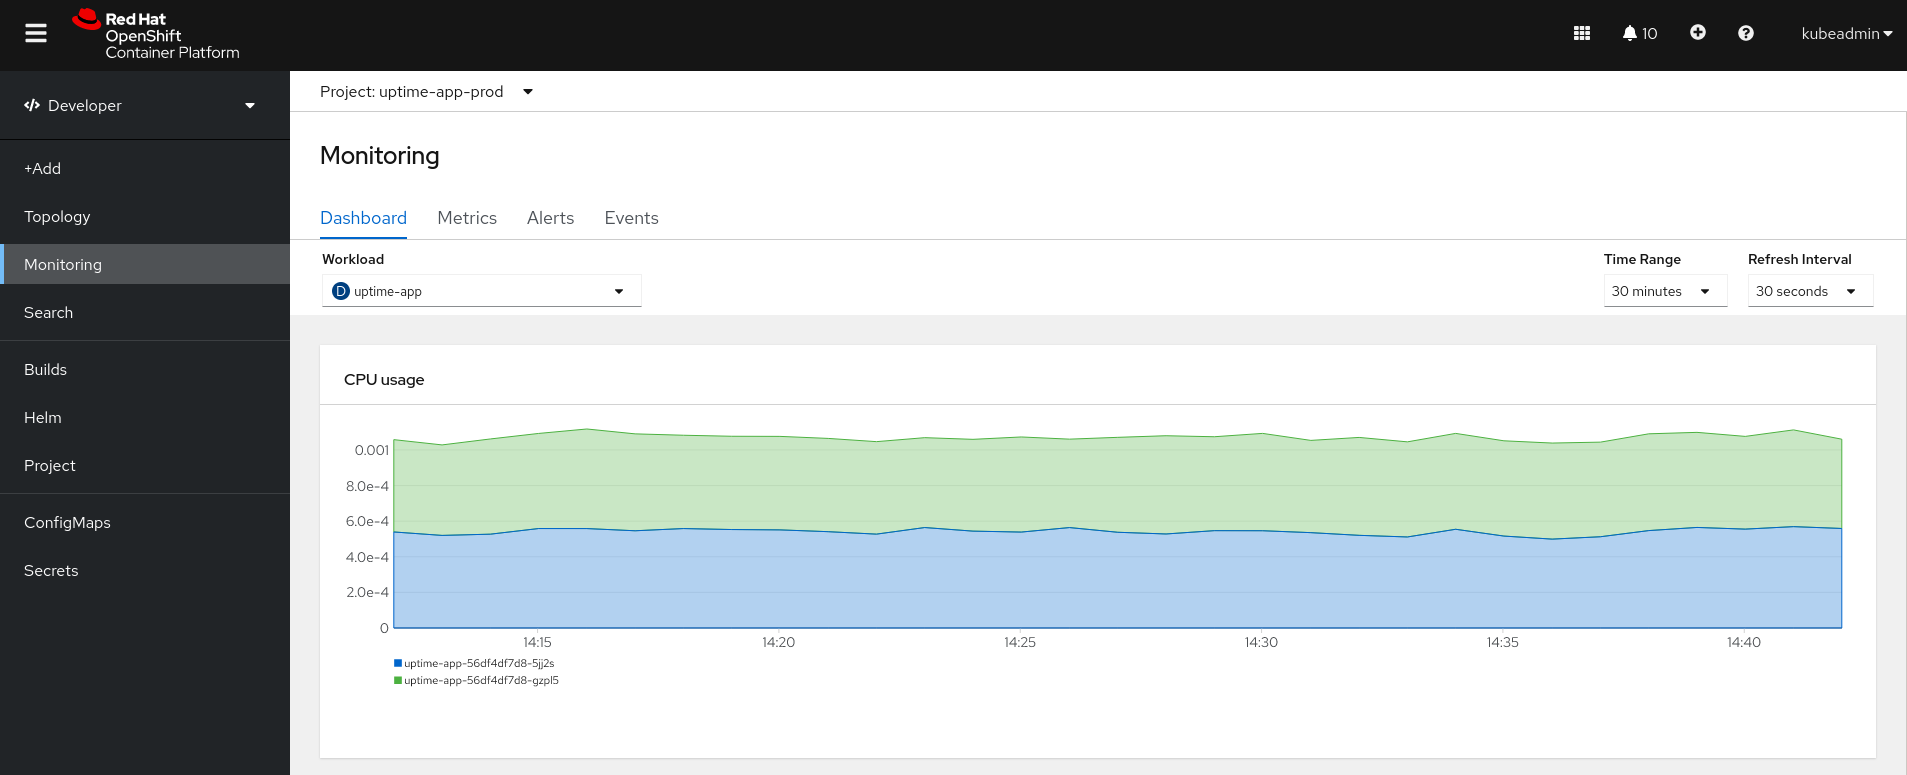
Switch to the Developer console and select the uptime-app-prod project. Then navigate to the Observing tab. Select the uptime-app in the Workload drop-down list. This will display a wide selection of different metrics relevant to your app like CPU usage, memory usage and networking performance.
Task 3.1.2: Provided alerting rules
OpenShift provides an extensive set of alerts, based on the kubernetes-mixin project. Check out the configured alerts by navigating to Observe -> Alerting -> Alerting rules and take a look at some of the predefined alerting rules.
Active alerts (state Pending or Firing) are displayed in Observe -> Alerting -> Alerts.
As you can see, these alerts are as generic as possible to fit most platforms. They cannot be altered and adding more rules in openshift-monitoring is not supported. In a later lab, you will learn how to add rules by enabling monitoring for user-defined projects.
Task 3.1.3: Create silences
Sometimes you have to silence an alert because someone is already working on it, or the issue is scheduled to be fixed in a future maintenance window, or it might be a false positive.
To do so, navigate to Observe -> Alerting -> Silences and hit the Create Silence button. A common task is to silence the UpdateAvailable alert, as we may have already scheduled the corresponding update.
Silence the alert for 1 week.
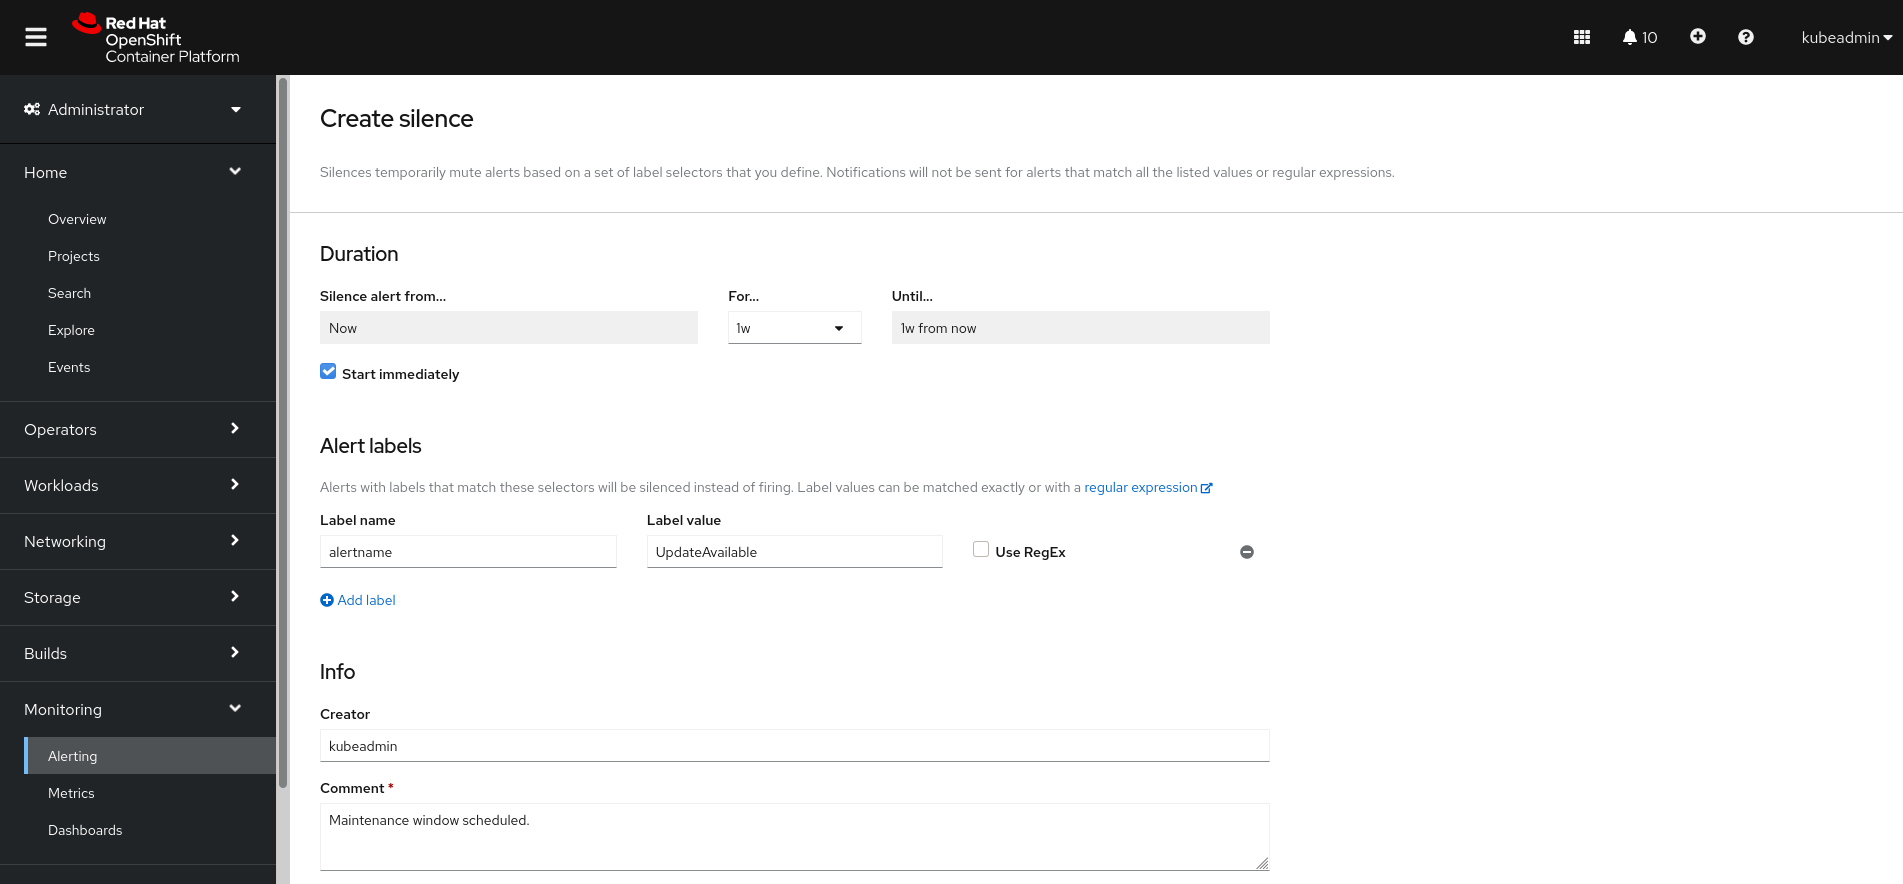
This will suppress all UpdateAvailable alerts for one week.